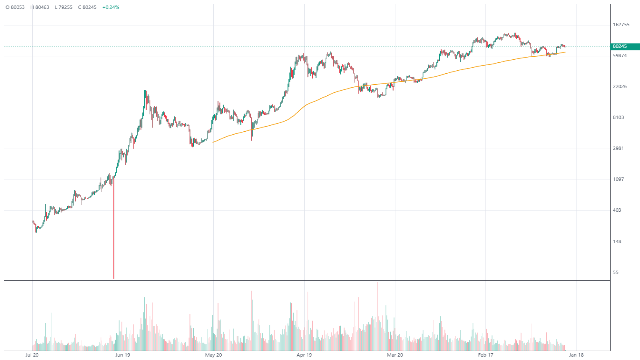

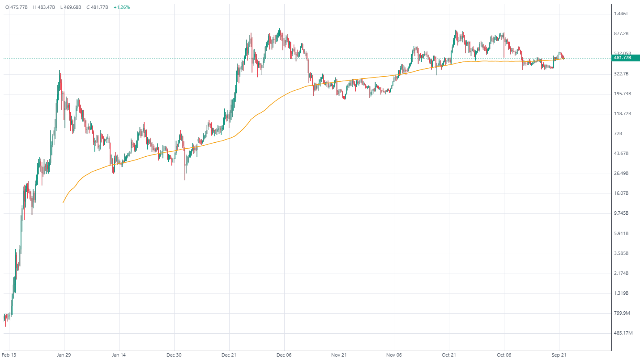
CANDLECAP:TOTAL3ES 200-week moving average
Right above 200-week moving average or the Charlie Munger line.
Community
Published chart setups, educational notes, and community commentary.
Right above 200-week moving average or the Charlie Munger line.
“If all you ever did was buy high-quality stocks on the 200-week moving average, you would beat the S&P 500 by a large margin over time. The problem is that few human beings have that kind of discipline.” Charlie Munger
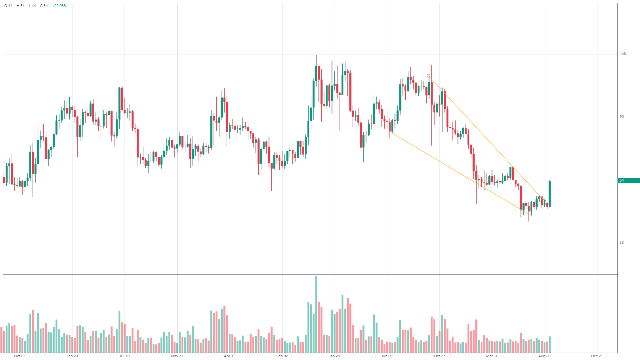
LTCUSD has pushed above the upper boundary of its multi-month falling wedge on the weekly chart, with expanding volume supporting the move. The breakout remains constructive while price holds above the former resistance zone near $47-$48. A weekly close back below that area would weaken the setup; sustained trade above $54 would strengthen the case for follow-through.
Publish your own setup from the workstation.
Open workstation